See exactly how your café, shop or workspace uses energy, every day of the year.
EnergyIQ connects to your existing electricity and gas metering to give you clear, real-time dashboards, automated monthly comparisons, and reports ready for landlords or council sustainability programmes. We monitor. We do not sell energy.
Clarity, without the spreadsheets.
Small commercial premises rarely have a dedicated facilities team. EnergyIQ was built to hand you clean, readable data instead of raw meter exports, so your energy story is easy to tell and easy to act on.
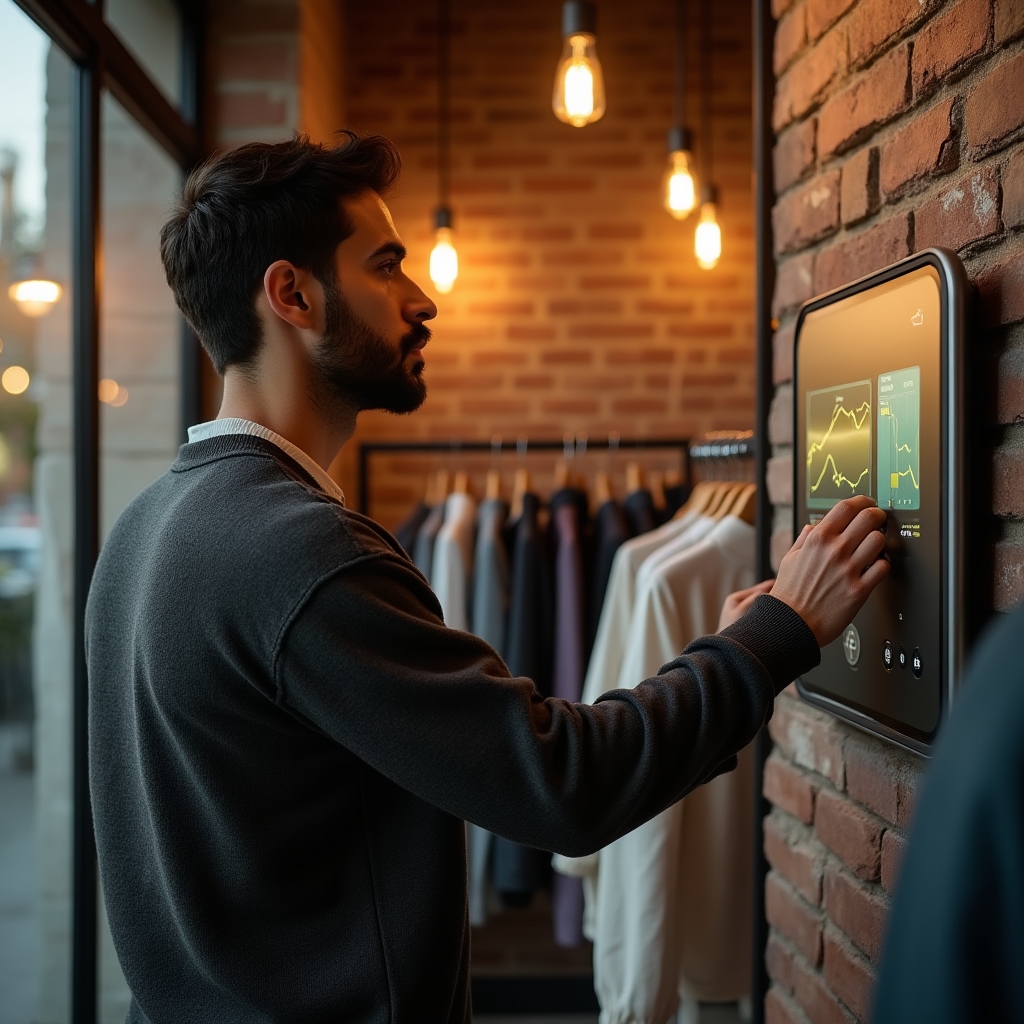
Live dashboards
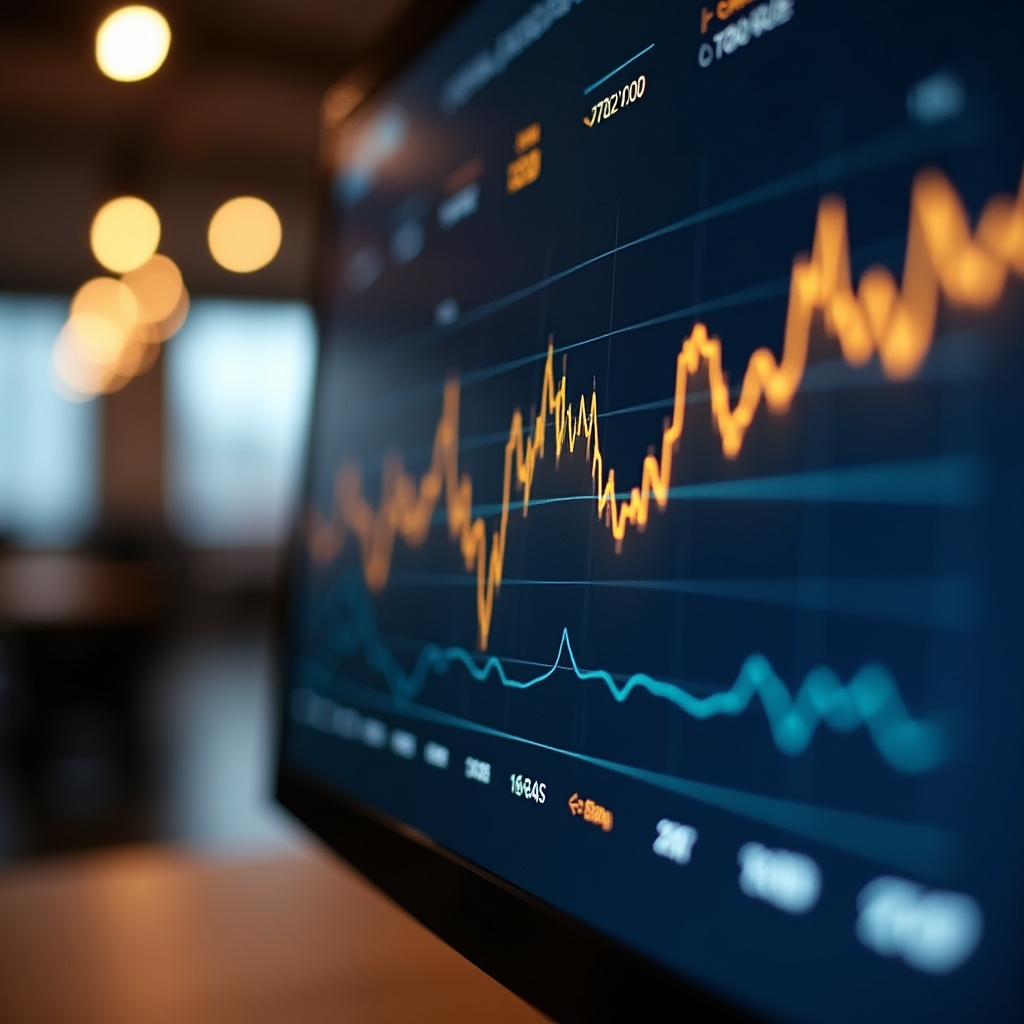
Electricity and gas usage displayed in near real time, broken down by hour, day and week so patterns are easy to spot.
Monthly comparisons
Automated month-on-month and year-on-year comparisons highlight shifts in consumption without manual calculation.
Baseline alerts
Set a baseline for your premises and receive a notification whenever usage moves meaningfully above it.
Formatted reports
Export reports structured for landlord requests or council sustainability programmes, ready to submit as is.
A measured path from meter to report.
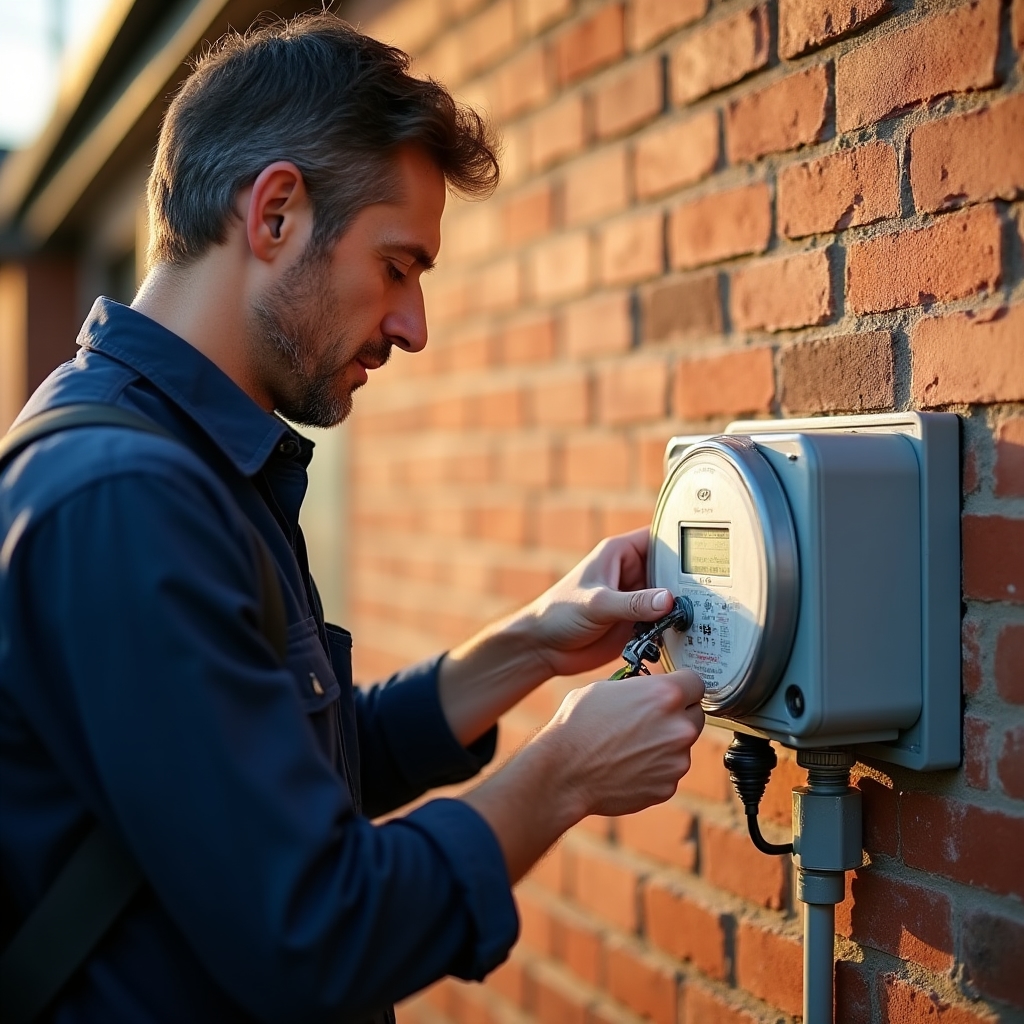
Connect your existing meters
We work with your current electricity and gas metering setup. A technician or a simple self-install kit links your meters to the EnergyIQ platform, usually within a single visit.
Watch consumption unfold
Your dashboard updates continuously. You can view live draw, daily totals, and how today compares with the same day last week or last month.
Generate your report
When it is time to report to a landlord or a council sustainability scheme, export a formatted document directly from your account in a few clicks.
Cafés, retail floors and shared workspaces.
Every premises type has its own rhythm of consumption. EnergyIQ adapts its baselines and alerts to the pattern of your business rather than applying a generic threshold.


Everything you need, nothing you don't.
- Separate electricity and gas views, with combined cost-equivalent context
- Baseline lines overlaid directly on the usage graph for instant comparison
- Alert history so you can review what triggered a notification and when
- One-click export to PDF or spreadsheet, formatted for external submission
- Multi-site view for operators managing more than one premises
Reports that speak the language of landlords and councils.
Many sustainability programmes and lease agreements ask for consumption data in a specific format. EnergyIQ produces documents structured around common reporting templates used across Australian councils and commercial tenancy agreements, saving you the manual formatting work.
Council sustainability programmes
Export summaries aligned with the kind of consumption detail these programmes typically request, ready to attach to your submission.
Landlord and lease reporting
Some commercial leases require periodic energy disclosure. Generate a clean summary covering the exact period requested.
Curious how your premises would look on a dashboard?
Arrange a short walkthrough and see your own consumption data represented clearly, with no obligation attached.
Get in touch